Lesson 3: Profiling & Performance
Every developer has a theory about why their game is slow, and most of those theories are wrong. In this lesson you learn to measure a frame with perf_counter, cProfile and timeit, then fix only what the numbers point at, and you'll see a few popular "optimizations" turn out to make no difference at all.
🎯 Learning Objectives
By the end of this lesson, you will be able to:
- Measure how many milliseconds each phase of a frame takes with
time.perf_counter()and a rolling average. - Profile a game with cProfile and read a pstats report sorted by own time and by cumulative time.
- Compare two ways of doing something with
timeit, and state the result with the machine it ran on. - Apply the rendering fixes that measure well in pygame-ce:
convert()/convert_alpha(), cached fonts and text,fblits(), and dirty rectangles that really erase. - Explain why an algorithm change (every pair versus a spatial hash) beats any amount of micro-tuning.
Project: Hot Path Hunt, a 400-ball collision scene with live profile bars, where you find and fix the two real bottlenecks.
In This Lesson
🎯 Measure First
A frame has a budget. At 60 FPS, input, update and drawing together must fit in 1000 ÷ 60 ≈ 16.7 milliseconds; at 30 FPS the budget is 33.3 ms. When a game stutters, some part of the frame is overspending, and the only question that matters is which part.
Intuition is bad at that question. It tracks how complicated code looks, while time is spent where number of calls × cost per call is largest. A three-line loop that runs 80,000 times a frame can cost far more than a hundred-line function that runs once.
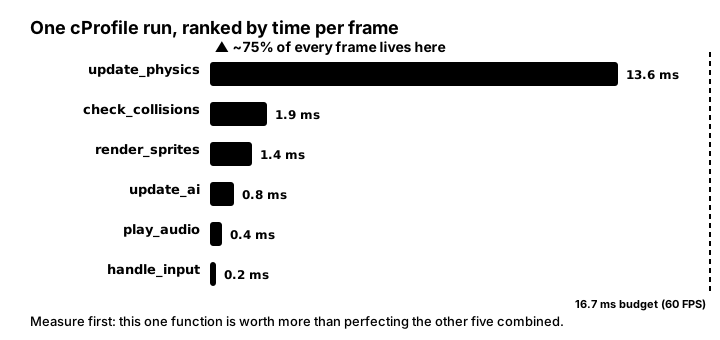
So every optimization in this lesson follows the same four steps:
- Reproduce the slow case (400 balls, the busiest level) and keep it fixed.
- Measure where the time goes.
- Change one thing, the biggest cost first.
- Measure again, and keep the change only if the numbers improved.
💡 Why this matters
Performance work without measurement costs twice: the time spent "optimizing" code that wasn't slow, and the readability lost in the process. That's also why it's common practice to profile on the slowest hardware you plan to support. The habit you build here, "show me the numbers", is one of the most valuable things a programmer can bring to a team.
📏 Timing Phases with perf_counter
The simplest profiler is a stopwatch around each phase of the frame. time.perf_counter() is Python's high-resolution clock for measuring short intervals (it never jumps backwards, unlike time.time(), which follows the wall clock). One frame's number is noisy, so keep a rolling average:
import time
from collections import deque


class PhaseTimer:
    """Rolling average (last 60 frames) of milliseconds spent in each phase."""

    def __init__(self, phases):
        self.samples = {name: deque(maxlen=60) for name in phases}

    def add(self, phase, seconds):
        self.samples[phase].append(seconds * 1000)

    def average(self, phase):
        s = self.samples[phase]
        return sum(s) / len(s) if s else 0.0


# inside the game loop:
t0 = time.perf_counter()
update_world(dt)
t1 = time.perf_counter()
draw_world(screen)
t2 = time.perf_counter()
timer.add("update", t1 - t0)
timer.add("draw", t2 - t1)
Draw the averages as bars on screen (the exercise does this) and you can watch a phase's cost change as you play. A deque(maxlen=60) drops the oldest sample automatically, so the average always covers about the last second.
🧭 Don't time clock.tick()
clock.tick(60) sleeps for whatever is left of the frame budget. Put your stopwatches around real work only; otherwise a fast frame looks slow because it spent 14 ms waiting.
🔬 cProfile: Where Does the Time Go?
Phase timers tell you which phase is slow; a profiler tells you which function. Python ships one: cProfile records every function call and how long it took. The quickest way to use it is from the terminal, then play for a while and close the window:
python -m cProfile -s tottime my_game.pyFor a repeatable measurement, profile a fixed amount of work from code. This complete program simulates 120 frames of 300 balls, drawing onto an off-screen Surface, so it needs no window and ends by itself:
import cProfile
import pstats
import random

import pygame

WIDTH, HEIGHT, RADIUS = 800, 450, 6


def make_balls(n, rng):
    return [[pygame.Vector2(rng.uniform(0, WIDTH), rng.uniform(0, HEIGHT)),
             pygame.Vector2(rng.uniform(-150, 150), rng.uniform(-150, 150))] for _ in range(n)]


def move(balls, dt):
    for pos, vel in balls:
        pos += vel * dt
        pos.x %= WIDTH                  # wrap around the edges
        pos.y %= HEIGHT


def count_touching(balls):
    touching = 0
    for i in range(len(balls)):         # every pair: n * (n - 1) / 2 checks
        for j in range(i + 1, len(balls)):
            if balls[i][0].distance_squared_to(balls[j][0]) < (2 * RADIUS) ** 2:
                touching += 1
    return touching


def draw(surface, balls):
    surface.fill((20, 20, 30))
    for pos, _ in balls:
        pygame.draw.circle(surface, (240, 140, 60), pos, RADIUS)


def run(frames=120):
    rng = random.Random(1)
    balls = make_balls(300, rng)
    canvas = pygame.Surface((WIDTH, HEIGHT))    # draw off-screen: no window needed
    for _ in range(frames):
        move(balls, 1 / 60)
        count_touching(balls)
        draw(canvas, balls)


with cProfile.Profile() as profiler:
    run()
stats = pstats.Stats(profiler).strip_dirs()
stats.sort_stats("tottime").print_stats(5)
On my machine (an Intel Core i7-12700K, Python 3.10, pygame-ce 2.5.8, under WSL2) it printed:
         5457010 function calls in 1.969 seconds

   Ordered by: internal time
   List reduced from 18 to 5 due to restriction <5>

   ncalls  tottime  percall  cumtime  percall filename:lineno(function)
      120    1.711    0.014    1.930    0.016 profile_demo.py:22(count_touching)
  5382000    0.217    0.000    0.217    0.000 {method 'distance_squared_to' of 'pygame.math.Vector2' objects}
    36000    0.014    0.000    0.014    0.000 {built-in method pygame.draw.circle}
      120    0.009    0.000    0.009    0.000 {method 'fill' of 'pygame.surface.Surface' objects}
120 0.009 0.000 0.009 0.000 profile_demo.py:15(move)| Column | Meaning | Read it as |
|---|---|---|
ncalls | How many times the function was called | 5,382,000 is 120 frames × 44,850 pairs: the every-pair loop |
tottime | Time inside the function itself, not counting functions it called | "Where is the work done?" |
cumtime | Time inside the function including everything it called | "Which part of my program is expensive?" |
percall | The previous column divided by calls | About 0.016 s per frame for count_touching (with the profiler's overhead): the whole budget |
The report is unambiguous: drawing 36,000 circles took 0.014 s in total, while checking pairs took 1.9 s. Speeding up drawing could never fix this program. Sort by "cumulative" when you want to see which high-level function (say, update_level) contains the slow part, and by "tottime" to find the exact line of work.
Two cautions. cProfile adds overhead to every call, so the absolute times are inflated; trust the ranking, then confirm with your phase timers. And when you profile a real game loop, {method 'tick' of 'pygame.time.Clock' objects} will often top the list: that is the frame cap sleeping, not work.
For memory rather than time, the standard library's tracemalloc compares two snapshots and lists the lines that allocated the most:
import tracemalloc

tracemalloc.start()
before = tracemalloc.take_snapshot()
load_level("level3")                       # the code you suspect
after = tracemalloc.take_snapshot()
for stat in after.compare_to(before, "lineno")[:5]:
    print(stat)                            # file:line, size and count of new allocations
🧪 timeit: Settle Arguments with Numbers
"Blitting a cached circle is faster than drawing one." "Rendering text every frame is slow." Claims like these are easy to test. The timeit module runs a small piece of code many times and reports the total; taking the best of several repeats filters out interruptions from the rest of your system. This program measures seven common claims:
import io
import timeit

import pygame

pygame.init()
screen = pygame.display.set_mode((960, 540))    # convert() needs a display first


def loaded_png(surface):
    """Save a Surface as PNG bytes and load it back, like pygame.image.load("x.png")."""
    data = io.BytesIO()
    pygame.image.save(surface, data, "sprite.png")
    data.seek(0)
    return pygame.image.load(data, "sprite.png")


art = pygame.Surface((64, 64), pygame.SRCALPHA)
pygame.draw.circle(art, (200, 80, 40), (32, 32), 30)
raw = loaded_png(art)                   # as it comes from disk
fast = raw.convert_alpha()              # same pixels, the display's pixel format
dot = pygame.Surface((26, 26), pygame.SRCALPHA)
pygame.draw.circle(dot, (200, 100, 50), (13, 13), 12)
font = pygame.font.Font(None, 24)
label = font.render("Score: 12345", True, (255, 255, 255))

tests = {
    "blit PNG, not converted": lambda: screen.blit(raw, (100, 100)),
    "blit PNG, convert_alpha()": lambda: screen.blit(fast, (100, 100)),
    "draw.circle radius 12": lambda: pygame.draw.circle(screen, (200, 100, 50), (200, 200), 12),
    "blit a cached circle": lambda: screen.blit(dot, (187, 187)),
    "font.render every time": lambda: font.render("Score: 12345", True, (255, 255, 255)),
    "blit a cached label": lambda: screen.blit(label, (10, 10)),
    "create Font(None, 24)": lambda: pygame.font.Font(None, 24),
}
for name, func in tests.items():
    runs = 2000
    best = min(timeit.repeat(func, number=runs, repeat=5)) / runs
    print(f"{name:28} {best * 1e6:8.2f} microseconds")
pygame.quit()
Here are the results from three runs on the machine above (SDL's dummy video driver, so no real window). Your numbers will differ; the ratios are what to compare.
| Operation | Measured (µs per call) | What it tells you |
|---|---|---|
| Blit a PNG sprite, not converted | 40 to 44 | Roughly 28 to 30× faster after convert_alpha(). A real win. |
Blit the same sprite after convert_alpha() | 1.4 to 1.5 | |
pygame.draw.circle, radius 12 | 0.5 to 0.7 | No meaningful difference. Caching circles is not worth the code here. |
| Blit a pre-drawn circle Surface | 0.45 to 0.6 | |
font.render() a short label | 4 to 6 | Rendering costs several times a blit, but a few labels per frame are still tiny. |
| Blit a label rendered earlier | 0.7 to 0.8 | |
Create pygame.font.Font(None, 24) | 89 to 105 | Creating fonts is the expensive part: do it once, never in the loop. |
Two of the folk rules held up (convert your images, create fonts once) and one did not (pre-rendering simple circles), at least for this size and this machine. That is the point of measuring: a rule you've verified is knowledge; a rule you haven't is a guess.
✅ Growth Mindset: Being Wrong Is the Measurement Working
It stings a little when a speed-up you were sure about measures as zero. That moment is not failure; it's the whole method doing its job, and every experienced performance engineer has a long list of their own wrong guesses. Write your prediction down before you run the benchmark, then compare. Over time your guesses get better, but you still measure, because the numbers are the only thing that can tell you whether you're right, yet.
🎨 Rendering Fixes That Hold Up
pygame-ce draws Surfaces with the CPU, so advice written for GPU engines ("batch your draw calls", "reduce texture switches") doesn't transfer. What costs time here is pixel format conversions, the number of Python-level calls, and how many pixels you touch.
Convert every image once, right after loading. A PNG comes off disk in whatever pixel layout the file had. convert_alpha() (images with transparency) or convert() (opaque images) re-stores it in the display's format so each blit is a straight copy. Both need a display, so call them after set_mode(). Interestingly, when I loaded an opaque JPEG the same way, convert() made no measurable difference to its blit time on this machine; converting is still the safe default, but that result is another reason to measure your own assets.
ASSETS = Path(__file__).parent / "assets"
screen = pygame.display.set_mode((960, 540))
ship = pygame.image.load(ASSETS / "ship.png").convert_alpha()   # once, at load time
Cache what doesn't change. Create fonts at startup. Render a label again only when its text changes (keep the last string and the last Surface). Pre-rotate or pre-scale images you would otherwise transform every frame; pygame.transform.rotate builds a whole new Surface each call.
Batch many small blits. screen.blits(seq) takes a list of (surface, position) pairs, and screen.fblits(seq) is a faster variant that skips returning rectangles. For 1,000 blits of a 24 × 24 sprite, I measured about 0.6 ms with a Python loop, 0.45 to 0.53 ms with blits(seq, doreturn=False), and about 0.34 ms with fblits(seq). That is a real but modest gain; reach for it after the bigger fixes.
Dirty rectangles, done right. pygame.display.flip() sends the whole screen to the window. When only a few small things move over a static background, you can send just the areas that changed with pygame.display.update(rects). The classic bug is forgetting that an object's old position changed too:
old_rect = player_rect.copy()                   # where it WAS
player_rect.center = player_pos                 # move it
screen.blit(background, old_rect, old_rect)     # 1. erase the old spot with the background
screen.blit(player_image, player_rect)          # 2. draw the new spot
pygame.display.update([old_rect, player_rect])  # 3. both areas changed
Skip step 1 and every moving object leaves a trail; send only the new rectangle and the old image stays on screen. pygame's LayeredDirty group does this bookkeeping for you: give it the background with clear(), set sprite.dirty = 1 whenever a sprite moves, and draw() returns exactly the rectangles to update. A complete example:
import random

import pygame

WIDTH, HEIGHT = 800, 450


class Blip(pygame.sprite.DirtySprite):
    def __init__(self, rng, *groups):
        super().__init__(*groups)
        self.image = pygame.Surface((16, 16), pygame.SRCALPHA)
        pygame.draw.circle(self.image, (250, 204, 21), (8, 8), 8)
        self.pos = pygame.Vector2(rng.uniform(20, WIDTH - 20), rng.uniform(20, HEIGHT - 20))
        self.vel = pygame.Vector2(rng.uniform(-120, 120), rng.uniform(-120, 120))   # px/s
        self.rect = self.image.get_rect(center=(round(self.pos.x), round(self.pos.y)))

    def update(self, dt):
        self.pos += self.vel * dt
        if self.pos.x < 8:
            self.pos.x, self.vel.x = 8, abs(self.vel.x)
        elif self.pos.x > WIDTH - 8:
            self.pos.x, self.vel.x = WIDTH - 8, -abs(self.vel.x)
        if self.pos.y < 8:
            self.pos.y, self.vel.y = 8, abs(self.vel.y)
        elif self.pos.y > HEIGHT - 8:
            self.pos.y, self.vel.y = HEIGHT - 8, -abs(self.vel.y)
        new_center = (round(self.pos.x), round(self.pos.y))
        if new_center != self.rect.center:
            self.rect.center = new_center
            self.dirty = 1                  # "I moved: redraw my old and new area"


pygame.init()
screen = pygame.display.set_mode((WIDTH, HEIGHT))
pygame.display.set_caption("Dirty rectangles with LayeredDirty")
clock = pygame.time.Clock()

background = pygame.Surface((WIDTH, HEIGHT)).convert()
background.fill((15, 23, 42))
for x in range(0, WIDTH, 40):               # a detailed background drawn only once
    pygame.draw.line(background, (30, 41, 59), (x, 0), (x, HEIGHT))
screen.blit(background, (0, 0))
pygame.display.flip()

rng = random.Random(3)
blips = pygame.sprite.LayeredDirty()
for _ in range(30):
    Blip(rng, blips)
blips.clear(screen, background)             # erase old positions with this background

running = True
while running:
    dt = clock.tick(60) / 1000
    for event in pygame.event.get():
        if event.type == pygame.QUIT:
            running = False
    blips.update(dt)
    changed = blips.draw(screen)            # returns only the rectangles that changed
    pygame.display.update(changed)          # push just those areas to the window

pygame.quit()
Dirty rectangles only pay off when a small part of the screen changes. A scrolling camera, a full-screen effect or a busy particle storm changes nearly every pixel anyway, and then plain flip() is simpler. Measure both on your game before committing to either.
🧮 Algorithms Beat Micro-Tweaks
Checking every pair of n objects costs n × (n − 1) ÷ 2 tests: 4,950 for 100 balls, 79,800 for 400 and 499,500 for 1,000. Doubling the objects roughly quadruples the work. The spatial hash you built in Spatial Hashing & Object Pools only tests objects in the same or neighboring cells. Here is what the exercise's two collision functions measured on my machine (7 px balls in a 960 × 430 area, cells 14 px wide):
| Balls | Every pair: tests | Every pair: ms | Spatial hash: tests | Spatial hash: ms |
|---|---|---|---|---|
| 100 | 4,950 | 1.2 | 20 | 0.2 |
| 400 | 79,800 | 19.5 | 241 | 0.55 |
| 1,000 | 499,500 | 132 | 1,723 | 2.2 |
At 400 balls the every-pair version alone blows the 16.7 ms budget; the spatial hash uses about 3% of it. No constant-factor trick could have closed that gap: even making each pair test ten times faster would leave the every-pair version at about 2 ms for 400 balls and about 13 ms for 1,000, still slower than the hash, and falling further behind as the count grows. The number of spatial-hash tests depends on how crowded the cells are, which is why the table reports measured counts rather than a formula.
One correctness detail matters here. When you loop "for each ball, for each neighbor", every touching pair shows up twice: once from each side. If the collision response swaps velocities both times, it swaps them back, and the balls pass through each other. Keep only pairs with j > i so each pair is handled exactly once:
for i, (cx, cy) in enumerate(keys):
    for dx in (-1, 0, 1):
        for dy in (-1, 0, 1):
            for j in buckets.get((cx + dx, cy + dy), ()):
                if j > i:                    # each pair once, never a ball with itself
                    pairs.append((i, j))
🚫 Advice to skip
You will find old tips online written for C in the 1990s: lookup tables for sin, "fast inverse square root" tricks, "avoid square roots, they are slow". In Python, the cost of running your own Python code dwarfs a single call to math.sqrt or math.sin, so these tricks add complexity for no measurable gain. The same goes for any tip that comes without a measurement: test it on your game or leave it out.
🏋️ Practice Exercise: Hot Path Hunt
Objective: add phase timing to a slow 400-ball collision scene, use cProfile to find the hotspot, and fix the two bottlenecks the numbers point to.
Time: about 60 minutes. Starter file: hot_path_starter.py (your instructor has it). It runs, but checks every pair, never converts its image, and times nothing. Its numbered TODOs match these steps.
- Run the starter and note the FPS. Write it down. (≈ 3 min)
- Record the three phases with
timer.add(...)using thet0–t3timestamps already in the loop. The bars come alive. (≈ 10 min) - Press K and read the cProfile report in the terminal. Which function has the largest
tottime, and how does that match the bars? (≈ 10 min) - Write
pairs_spatial(): bucket ball indexes by cell, look in the 3 × 3 block of cells, and keep pairs withj > i. Toggle S and compare the collide bar. (≈ 20 min) - Convert the ball image with
convert_alpha(). Toggle C and compare the draw bar. (≈ 7 min) - Close the window and copy the printed averages into a comment: before and after each fix. (≈ 10 min)
You are done when:
- the profile bars show real numbers for update, collide and draw;
- with S on, the collide bar is a small fraction of what it was with S off, and the balls still bounce off each other;
- with C on, the draw bar drops;
- your comment records the before and after averages from your own machine.
💡 Hint
The cell size is CELL = 2 * RADIUS, so two touching balls are never more than one cell apart; that's why the 3 × 3 block is enough. Build keys (each ball's cell) and buckets (cell → list of indexes) in one loop, then find pairs in a second loop. If balls start passing through each other, you're probably adding each pair twice: check the j > i test.
✅ Example Solution
Your instructor's lab file also has a few lines marked lab runtime and and frame_budget() in the loop, so a checker can run it automatically. You don't need them.
"""Hot Path Hunt: Advanced Lesson 3 practice exercise (solution).

Hundreds of balls bounce and collide. Live profile bars show how many
milliseconds each phase of the frame takes. Two toggles apply the two fixes
that measuring points to:
    S  spatial-hash broad phase on/off (off = check every pair)
    C  convert_alpha() on the ball image on/off
    P  profile bars on/off
    K  run cProfile over the next 120 frames and print the top functions
Close the window to quit; averages per phase are printed at the end.
"""
import cProfile
import io
import pstats
import random
import time
from collections import deque

import pygame


WIDTH, HEIGHT = 960, 540
HUD_HEIGHT = 110
PLAY_BOTTOM = HEIGHT - HUD_HEIGHT       # balls live above the HUD band
BALL_COUNT = 400
RADIUS = 7
CELL = 2 * RADIUS                       # a cell as wide as a ball: neighbors are enough
PROFILE_FRAMES = 120
BG_COLOR = (18, 20, 30)
TEXT_COLOR = (225, 228, 235)
PHASE_COLORS = {"update": (110, 200, 120), "collide": (230, 110, 110), "draw": (110, 160, 235)}


class Ball:
    def __init__(self, rng):
        self.pos = pygame.Vector2(rng.uniform(RADIUS, WIDTH - RADIUS),
                                  rng.uniform(RADIUS, PLAY_BOTTOM - RADIUS))
        self.vel = pygame.Vector2(rng.uniform(-160, 160), rng.uniform(-160, 160))   # px/s


def move_balls(balls, dt):
    """Move every ball and bounce it off the play area: push back, then point away."""
    for b in balls:
        b.pos += b.vel * dt
        if b.pos.x < RADIUS:
            b.pos.x, b.vel.x = RADIUS, abs(b.vel.x)
        elif b.pos.x > WIDTH - RADIUS:
            b.pos.x, b.vel.x = WIDTH - RADIUS, -abs(b.vel.x)
        if b.pos.y < RADIUS:
            b.pos.y, b.vel.y = RADIUS, abs(b.vel.y)
        elif b.pos.y > PLAY_BOTTOM - RADIUS:
            b.pos.y, b.vel.y = PLAY_BOTTOM - RADIUS, -abs(b.vel.y)


def pairs_naive(balls):
    """Every pair (i, j) with i < j: n * (n - 1) / 2 candidate pairs."""
    n = len(balls)
    return [(i, j) for i in range(n) for j in range(i + 1, n)]


def pairs_spatial(balls, cell=CELL):
    """Only pairs in the same or a neighboring grid cell. Each pair appears exactly once."""
    buckets = {}
    keys = []
    for i, b in enumerate(balls):
        key = (int(b.pos.x // cell), int(b.pos.y // cell))
        keys.append(key)
        buckets.setdefault(key, []).append(i)
    pairs = []
    for i, (cx, cy) in enumerate(keys):
        for dx in (-1, 0, 1):
            for dy in (-1, 0, 1):
                for j in buckets.get((cx + dx, cy + dy), ()):
                    if j > i:               # i < j only: no pair twice, no ball with itself
                        pairs.append((i, j))
    return pairs


def resolve(balls, pairs):
    """Bounce overlapping equal-mass balls. Returns how many pairs touched."""
    hits = 0
    min_dist_sq = (2 * RADIUS) ** 2
    for i, j in pairs:
        a, b = balls[i], balls[j]
        delta = b.pos - a.pos
        dist_sq = delta.length_squared()
        if dist_sq >= min_dist_sq or dist_sq == 0:
            continue
        hits += 1
        normal = delta / dist_sq ** 0.5
        overlap = 2 * RADIUS - dist_sq ** 0.5
        a.pos -= normal * (overlap / 2)       # separate so they don't stay stuck
        b.pos += normal * (overlap / 2)
        closing = (a.vel - b.vel).dot(normal)
        if closing > 0:                       # only if they are moving toward each other
            a.vel -= normal * closing         # equal masses: swap the normal components
            b.vel += normal * closing
    return hits


def make_ball_image():
    """Draw a ball, then save and reload it as PNG bytes, exactly like loading a file."""
    surf = pygame.Surface((2 * RADIUS, 2 * RADIUS), pygame.SRCALPHA)
    pygame.draw.circle(surf, (240, 140, 60), (RADIUS, RADIUS), RADIUS)
    pygame.draw.circle(surf, (255, 220, 170), (RADIUS - 2, RADIUS - 2), 2)
    data = io.BytesIO()
    pygame.image.save(surf, data, "ball.png")
    data.seek(0)
    return pygame.image.load(data, "ball.png")    # not converted yet


class PhaseTimer:
    """Rolling average (last 60 frames) of milliseconds spent in each phase."""

    def __init__(self, phases):
        self.samples = {name: deque(maxlen=60) for name in phases}
        self.totals = {name: 0.0 for name in phases}
        self.frames = 0

    def add(self, phase, seconds):
        self.samples[phase].append(seconds * 1000)
        self.totals[phase] += seconds * 1000

    def average(self, phase):
        s = self.samples[phase]
        return sum(s) / len(s) if s else 0.0


def draw_hud(screen, font, timer, clock, settings, checks, hits):
    top = PLAY_BOTTOM
    pygame.draw.rect(screen, (30, 34, 48), (0, top, WIDTH, HUD_HEIGHT))
    lines = [
        f"FPS {clock.get_fps():5.1f}   balls {BALL_COUNT}   pair checks {checks}   touching {hits}",
        f"[S] spatial hash: {'ON ' if settings['spatial'] else 'OFF'}"
        f"   [C] convert_alpha: {'ON ' if settings['convert'] else 'OFF'}"
        f"   [P] bars   [K] cProfile",
    ]
    for n, line in enumerate(lines):
        screen.blit(font.render(line, True, TEXT_COLOR), (12, top + 8 + n * 22))
    if not settings["bars"]:
        return
    y = top + 56
    scale = 20                                  # 20 px per millisecond
    for phase, color in PHASE_COLORS.items():
        ms = timer.average(phase)
        pygame.draw.rect(screen, color, (110, y, min(ms * scale, WIDTH - 130), 12))
        screen.blit(font.render(f"{phase} {ms:5.2f} ms", True, TEXT_COLOR), (12, y - 3))
        y += 17


def main():
    pygame.init()
    screen = pygame.display.set_mode((WIDTH, HEIGHT))
    pygame.display.set_caption("Hot Path Hunt")
    clock = pygame.time.Clock()
    font = pygame.font.Font(None, 22)               # fonts are created once

    rng = random.Random(7)
    balls = [Ball(rng) for _ in range(BALL_COUNT)]
    raw_image = make_ball_image()
    fast_image = raw_image.convert_alpha()          # same pixels, display's pixel format
    settings = {"spatial": True, "convert": True, "bars": True}
    timer = PhaseTimer(PHASE_COLORS)
    profiler, profile_left = None, 0
    checks = hits = 0

    running = True
    while running:
        dt = clock.tick(60) / 1000
        for event in pygame.event.get():
            if event.type == pygame.QUIT:
                running = False
            elif event.type == pygame.KEYDOWN:
                if event.key == pygame.K_s:
                    settings["spatial"] = not settings["spatial"]
                elif event.key == pygame.K_c:
                    settings["convert"] = not settings["convert"]
                elif event.key == pygame.K_p:
                    settings["bars"] = not settings["bars"]
                elif event.key == pygame.K_k and profiler is None:
                    profiler, profile_left = cProfile.Profile(), PROFILE_FRAMES
                    profiler.enable()

        t0 = time.perf_counter()
        move_balls(balls, dt)
        t1 = time.perf_counter()
        pairs = pairs_spatial(balls) if settings["spatial"] else pairs_naive(balls)
        checks, hits = len(pairs), resolve(balls, pairs)
        t2 = time.perf_counter()
        screen.fill(BG_COLOR)
        image = fast_image if settings["convert"] else raw_image
        for b in balls:
            screen.blit(image, (b.pos.x - RADIUS, b.pos.y - RADIUS))
        t3 = time.perf_counter()
        timer.add("update", t1 - t0)
        timer.add("collide", t2 - t1)
        timer.add("draw", t3 - t2)
        timer.frames += 1

        draw_hud(screen, font, timer, clock, settings, checks, hits)
        pygame.display.flip()

        if profiler is not None:
            profile_left -= 1
            if profile_left == 0:
                profiler.disable()
                print(f"cProfile report ({PROFILE_FRAMES} frames), top 6 by own time:")
                pstats.Stats(profiler).strip_dirs().sort_stats("tottime").print_stats(6)
                profiler = None

    pygame.quit()
    frames = max(timer.frames, 1)
    print(f"Hot Path Hunt finished after {timer.frames} frames.")
    for phase, total in timer.totals.items():
        print(f"average {phase}: {total / frames:.2f} ms")


if __name__ == "__main__":
    main()
📓 Learning Journal
Take five minutes to write in your learning journal (a notebook or a plain text file works). Jot down:
- Key concepts you learned today
- Techniques that clicked (and the ones that haven't, yet)
- Questions or confusion to bring to the next session
- Ideas to try in your own game
- Progress and feelings: how did this lesson go for you?
✍️ This lesson's prompts:
- Before you measured, which part of the Hot Path Hunt did you expect to be slowest? What did the numbers say?
- Pick one "performance tip" you had heard before this lesson. How would you test it with
timeit? - Which part of your own game would you profile first, and what would "fast enough" mean for it in milliseconds?
📝 Summary
A frame has a budget, and the only useful performance question is where that budget goes. You timed phases with perf_counter, found the exact hot function with cProfile, and settled small questions with timeit, writing down the machine every time. The numbers pointed at two real fixes, a spatial hash instead of checking every pair and convert_alpha() on loaded images, and showed that another popular tip, caching simple circles, made no measurable difference.
🎓 Key Takeaways
- Reproduce, measure, change one thing, measure again. Never optimize on a hunch.
- Time real work with
time.perf_counter()and rolling averages; don't timeclock.tick(). - cProfile's
tottimefinds where work happens,cumtimefinds which part of the program is expensive; trust its ranking more than its absolute numbers. - Measured wins in pygame-ce:
convert()/convert_alpha(), fonts created once,fblits()for many small blits, and correct dirty rectangles when little changes. - Changing the algorithm (every pair to a spatial hash) beats any micro-tweak once the object count grows.
- Report performance claims with the numbers and the machine, or don't make them.
🔭 Looking Ahead
Fast games still lose players if a crash eats their progress. In the next lesson, Robust Saves: Integrity, Versioning, Security, you'll build a save format that detects corruption, upgrades old saves, and never runs code hidden in a file.
❓ Common Questions
My game runs at 60 FPS already. Should I optimize anyway?
Profile it on the slowest machine you want to support, in the busiest scene. If it has headroom there, spend your time on the game instead. Optimization is a response to a measured problem, not a chore to do in advance.
Why do my timeit numbers change every time I run them?
Other programs, power saving and CPU boost all interfere. That's why you repeat and take the best (the run with the least interference). Compare two options in the same run of the same script, and look at ratios rather than exact microseconds.
Would numpy or a C extension make my collision loop faster?
It can, but it is a bigger change than it sounds, and it's the last step, not the first. Fix the algorithm first (the spatial hash cut the collision time about 35× at 400 balls), measure again, and only then consider moving the remaining hot loop into vectorized or compiled code.
Should I call convert_alpha() on Surfaces I create in code?
A Surface created with pygame.SRCALPHA after set_mode() usually already matches the display's format. In my measurement it blitted about as fast as a converted one. Calling convert_alpha() on it is harmless, so do it if you're unsure.
The profiler says tick takes most of the time. Is pygame slow?
No: clock.tick(60) sleeps until the next frame is due, and cProfile counts the sleep. It's a sign you have spare time in the frame. Look at the functions below it.
🎯 Quick Quiz
Question 1: Your game stutters in its busiest level. What should you do first?
Question 2: In a pstats report, what does tottime measure?
Question 3: Why must the spatial-hash pair loop keep only pairs with j > i?
Question 4: You move a sprite and call pygame.display.update([new_rect]) only. What do you see?
Question 5: Which change gave the largest measured speed-up in this lesson?
🌟 Going Further
- Cache the HUD text: change the exercise to re-render a HUD line only when its string changes, then measure whether it made a difference.
- Find the crossover: run the exercise with 50, 100 and 200 balls. Below what count is checking every pair just as fast as the spatial hash on your machine?
- Visualize a profile: save a report with
profiler.dump_stats("game.prof")and open it in a viewer such as SnakeViz (pip install snakeviz). - Read the docs: The Python Profilers, timeit, tracemalloc, and pygame-ce's Surface page for
blits()andfblits(). - Coming up in Game Dev III: Advanced: moderngl Foundations moves drawing onto the GPU, where the rules change again, and you measure again.